More often than not, developers need to investigate performance bottlenecks in their production applications and identify the cause of the issue. To do so, one prominent approach is continuous profiling, the process of collecting application performance data in a production environment and making that data available to developers for deeper analysis.
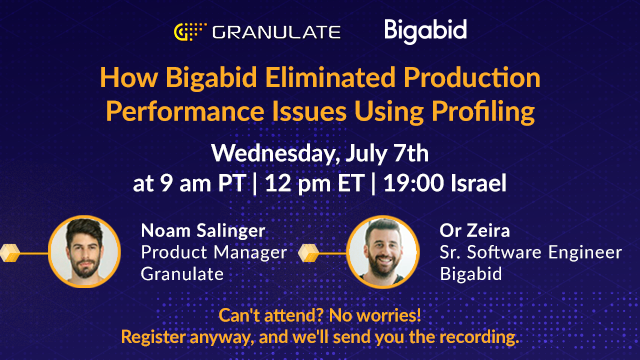
Join us to hear firsthand from Or Zeira, Senior Software Engineer at Bigabid, how they started using continuous profiling in their production environment, what performance issues were discovered, and what was the performance outcome.
In this webinar, you’ll learn:
- What production profiling is, and the benefits of using it
- Introduction to gProfiler: a new profiling tool by Granulate
- How Bigabid investigated performance to map code-level bottlenecks
- Tips and tricks to get started with profiling
* Can't attend? Register anyway and we'll send you the recording!
 Presented by